Responding to Linlithgow’s insistence on the need for market data to be available on a regular basis, a senior MAF official, Mr RJ Thomson, submitted a more detailed version of the government’s reservations over broadcasting raw price data without a standardised format or structure. Thomson told the commission that MAF was working on a “comparative index” that would somehow make sense of wholesale and retail price movements. It couldn’t be done in the 1920s and I’m not convinced we could do it in 2025. Take the example of a pig producer with slaughter weight bacon pig to sell in 1925. The creature is sold to a curer, who kills the animal and splits it into two sides of bacon. So far we have two mirror image halves of the same animal. One side of bacon goes to a Drury Lane emporium, the other to a Tyneside grocer on the east coast. The cuts that are taken off a London side of bacon, sold in a well-to-do part of London will earn more than the side of bacon shipped to Newcastle, even when the higher shipping costs are factored in. It is so predictable, but illogical, and index numbers won’t explain it.
It is not difficult to spot a flaw in M AF’s argument: the cumulative effect of the changes made at each stage are not counted as part of the process. Is this the only structural flaw?
The biggest challenge that faces traders of all descriptions in arriving at a reliable price structure is the speed at which food products can change. Some animal products undergo a series of changes from farmgate to end user, others barely change at all. Some foods deteriorate very fast, while others are stable; add to this processes such as grading and the scope for differentiation can spiral out of control. For a comparison to be usable, the items need a number of similarities, bearing in mind that not all users will have the same interests. At the risk of keeping alive a business myth, there were some retailers who chose to take a cut in their margins rather than push up prices. Some individual members of of the Linlithgow committee would have been very well informed about specific markets and sector, but less inclined perhaps to share.
The stability and predictability of sectors such as cereal crops, milling and baking followed a pattern of incremental development. The step from wholesale trade to retailing, however, marks a sea change, reflecting the finer detail in retail distribution and home delivery costs. Investing in automotive resources ran deep in the bedrock of the economy of the day and was not going to be neither quick nor cheap.
The constant chivvying for market data was neither focussed for the most part nor available in the sort of unambiguous form that would have helped lay readers to learn more about the free market edifice. For instance, try explaining day-to-day shifts in retail pricing, arising from wholesale price changes that operate on a different basis. Even the denominations of coinage had an impact in the pricing of the retail world.
The ministry dug its heels in and refused to make a rod for its own back. The public should not be left to be baboozled by the high power antics of economists. How could such experts in their individual fields be left to explain the rise in mutton prices was a consequence of higher wool prices? After all, sheep are not killed for their wool.
The Linlithgow committee made it clear to anyone who would listen, that there was more to determining a margin than taking procurement costs away from the current asking price. At one level, this is a tenable position, since a simple rule of thumb would refer to the difference between cost price and selling price as the profit or margin. This discussion was taking place in the dawn of radio broadcasting and there was a steady stream of demands for prices and market data to be made available on the new service, which had yet to develop a full set of public service expectations. There is no way of knowing who exactly was keen to learn the latest market data, but it is likely that a high proportion would have had a professional interest in market movements. Linlithgow and his committee members were adamant that: “…a crude comparison of producers’ or wholesale and retail prices would convey little to the consumer…” The end user, paying the full and final price is unlikely to look much further than a crude comparison, price being only one single aspect of a more complex transaction.
The market variables that determine the range of prices asked for a product will reflect, at the very least, a product’s provenance, its grade, (including ripeness or shelf life), as well as the number of outlets or sources which can supply the required quantity on the required date. It is only fair to observe that price and time often form an unholy alliance that pushes prices up dramatically. A little knowledge is a dangerous thing, too. The more you know about something, the greater its value and interest becomes. Needless to say, a product can also change on its way to the end user: large primal cuts of meat would be unmanageable in a domestic kitchen and yet they would be a tad cheaper by weight, reflecting the work that will be carried out between a meat trader buying a side of beef and a retail butcher cutting up stewing steak, for instance. Two prices might not be comparable for a host of reasons. In many ways, money is an incredibly blunt instrument when trying to make intelligent distinctions. But Linlithgow would probably have settled for a crude measure of value when faced with some of the alternatives: “We understand, however, that the Ministry has under consideration a proposal to publish regularly comparative index numbers which will indicate the movement of wholesale or retail prices.”
—–
There is a persistent belief in some quarters that price is an objective measure. This is only tenable in a one-dimensional market, since transactions have multiple dimensions and consequences that last for years.
The Departmental Committee on the Distribution and Prices of Agricultural Produce, generally referred to as the Linlithgow Committee, was proactive in its assessments and investigations of agricultural prices. Its remit covered the empire. The committee took its name from Victor Hope, 2nd Marquess of Linlithgow. He went on to chair a Royal Commission on food in India in 1928. Linlithgow, as the media called him, became the last viceroy of India: his 7-year tenure of office ended in 1943, amid scenes of chaos and civil unrest.
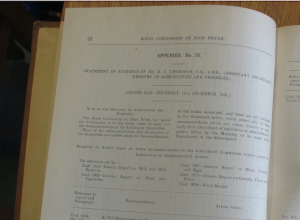
On December 11 1924, the second day of the 1925 Royal Commission, a senior MAF (Ministry of Agriculture and Fisheries) civil servant gave the government response to a raft of administrative measures recommended by the Linlithgow committee. Like a rabbit caught in car headlights, the MAF defence was more a limp lettuce than a fig leaf.
First up was a recommendation to standardise financial reporting for large companies such as United Dairies. MAF headed off further discussion, explaining that the government had “considered” introducing a bill, before playing its trump card: “The matter is now in the hands of the Board of Trade.” Next up, a suggestion that co-operative dairy schools should be revived is fended off with the assertion that a circular on the subject has been issued to all local authorities and “…steps are taken as opportunity offers.” Try getting that back out of the long grass.
The proposition that standing milk advisory committees should be set up to consider and discuss dairy industry issues as the need arose got short shrift. One of these bodies would cover Scotland, another would speak for the dairy industry in England and Wales: the topic prised about a dozen words from MAF: “Separate committees have been set up for England and Wales and for Scotland.” To finish the dairy section of the Linlithgow agenda, the committee urged the government to set and enforce minimum fat contents for whole milk cheese, cream and milk powder, which should apply both to imports and UK production. Sensing an imminent change of subject, the civil servant was more forthcoming. The health minister had made regulations that had come into force during May 1924. Meanwhile, the ministry of agriculture was: “…conducting investigations with a view to determining what standards, if any, may be adopted in respect of whole milk, cheese, and single and double cream.” Nothing gets past a pen pusher.
The Linlithgow committee and its extensive social network existed to promote the interests of landowner members. Its purpose was to develop a consensus around what constituted good practice, modern management and new routes to market. A fair proportion of these families would have benefitted from the compensation lavished on former slave owners: it never occurred to anyone that former slaves had a stronger case for reparations.
The Linlithgow committee (Lc) makes further recommendations, some of which I will list here, with MAF responses where relevant, including paras 258; 260; 302 and 303.
Para 258
Lc urges colleges and local authorities to train students in dairy production, as well as the prevention of spoilage. MAF agrees that this is worthy plan, even if some sites have needed assistance to reinstate standards.
para 260
Lc warns that whey is an ongoing problem, with little prospect of being profitable. MAF reports that a pilot plant has been transferred to Reading university, where development work is in hand.
The topic turns to commercial sharp practice: paras 209, 302 and 303. Since MAF replies to all these items in a single paragraph, I will add MAF’s response at the end of this post.
Lc is concerned that the practice of “averaging returns” is illegal and “not infrequent”. Growers should be checking all the entries on their invoices, the committee warned. Growers were not impressed. Another scam on similar lines started to rear its ugly head. By logging into the sales system under multiple identities, traders could cover their tracks and extract money from linked systems without being caught out.
Faced with significant numbers of food traders routinely breaking laws that may or may not have been enforceable in the first place, MAF resolutely turned its back and looked the other way:
“Efforts are being made to secure voluntary agreement between both sides of the industry on the points raised in their recommendations. If these efforts do not meet with success, it will be necessary to consider the introduction of legislation to deal with the points at issue.”
It would be reasonable to assume that it is the task of government to enforce existing laws and to review legislation that fails to meet the changing needs of the country. Accepting the status quo and asking both sides to play nicely in future resolves nothing. The problems will not go away without appropriate action; on the contrary, they will degenerate into crises.
For discussion of this theme in a more recent context, go to the contents page for France Loses Out and follow the links to individual topics.
More follows later: a series of related charts and some of the original text will be available in the near future.
Own label instant coffees are made with the same sort of coffee beans as their branded counterparts. The only difference is that the retailers control the pricing and, as retail brand owners, they are not held to ransom for shelf money. The Consumer Association magazine Which? is advising readers to switch to cheaper own label alternatives. To stand up its story, Which? gives the example of a 200g jar of Nescafé Original, which was selling for five and a half quid in supermarkets last year and is now the thick end of eight quid a pop on Ocado. Given the scale of Nescafé’s economies of scale in the procurement and manufacturing stages, how does one explain a 30% year on year price rise? Sure, the beans are more expensive, but what does the future hold for premium home delivery shopping channels?
Unlike any other science, economics is prone to give away the plot before the curtain rises. Behind the scenes, everyone is committed to turn out a happy ending, almost regardless. There is ambivalence towards change, even though the job description is built around identifying and predicting the future without fear or favour.
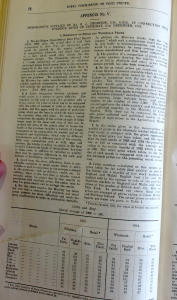
In the summer of 1914, the Ministry of Labour started collecting the food data for the Cost Of Living Index Number. Straight out of the gate, there is no way in which vegetables other than potatoes can be included in a year-round constant economic indicator. Potatoes can be stored all round the year and can be shipped from growers all over the world, whatever the season. We have already listed the foodstuffs that were monitored and index-weighted against other products or sectors. Having seen what the Ministry of Labour brought to the table, it is time to look at how the price points for these goods were settled. The researchers searched out prices displayed by over 5,000 retailers, even though there was a lot of repetition in the mix. In some areas, shopkeepers voluntarily maintained the same prices for known value items (KVI), a practice that would be unthinkable in the twenty-first century.
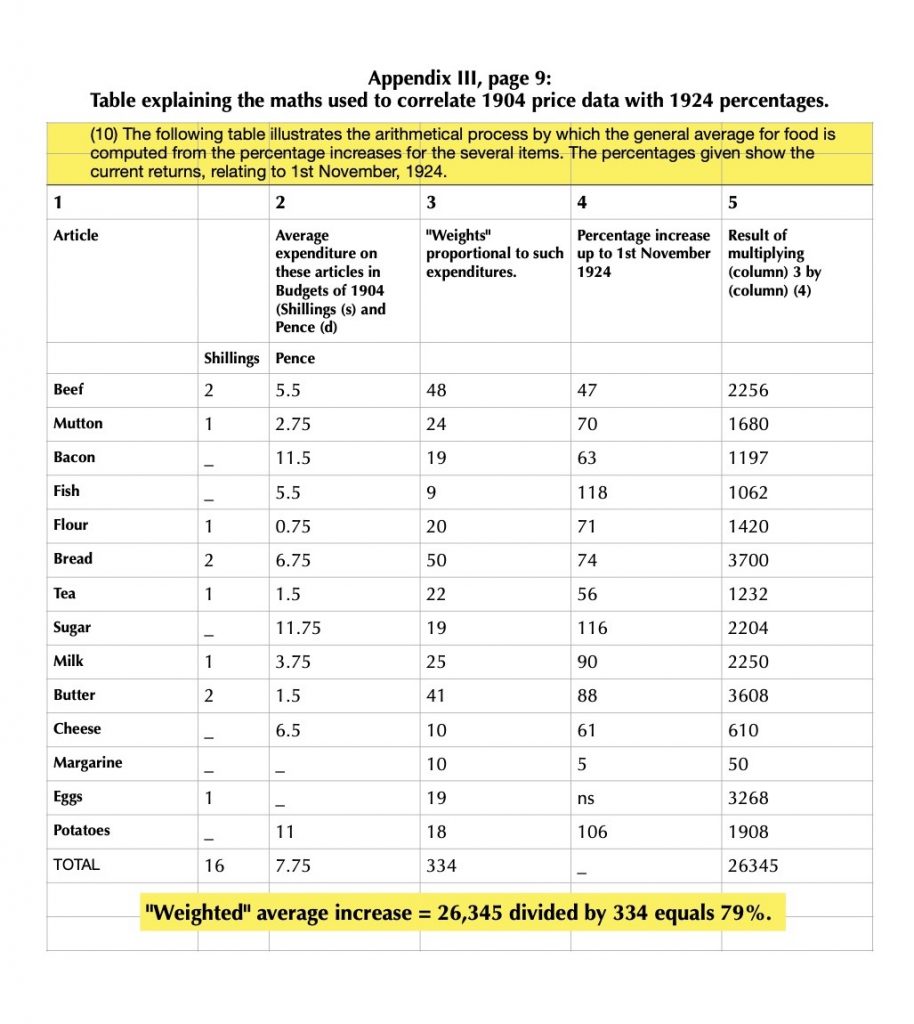
In the initial layout stages, some prices would be queried: if the point is to gather live data, it should be taken as found, warts and all. Modern food manufacturers refer to a group of products that are “liquid with identifible lumps” and I would apply the “identifiable lumps” analogy to raw price data. The lumps are the very point of the work in hand, giving both insight and substance. The process moves up a gear, averaging the product families and applying percentage shifts to some big and bulky calculations. Statistics at this level is not for the faint-hearted. The table below, taken from November 1924, is an example of the genre. Readers will notice that in this table, farthings are counted as 0.25, but this will change in the not-too-distant future to an integer, pure and simple.
The consumer panel was first used by the Board of Trade in 1904, when 1,944 urban working households were recruited. A footnote on page nine of the evidence volume reads:
The validity of using the budgets of 1904 was confirmed by the Working Classes Cost of Living Committee of 1918, under the Chairmanship of Lord Sumner, who reported that it was fairly certain that “Between 1904 and 1914…..no considerable changes took place in the mode or standard of living.”
The household data was calculated on the basis of the weight of food purchased, making comparisons between years more reliable, the civil servants argued. It is a moot point that a shop price in pounds, shillings and pence should resolve into a comparable pounds and ounces value at the table. To start with, the purchasing power of cash can and does change. The world in which we live is moving away from meaningful comparisons with previous eras, which need to be taken with a pinch of salt.
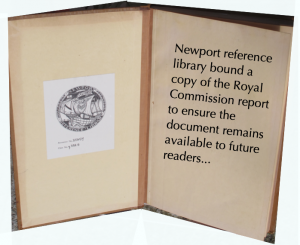
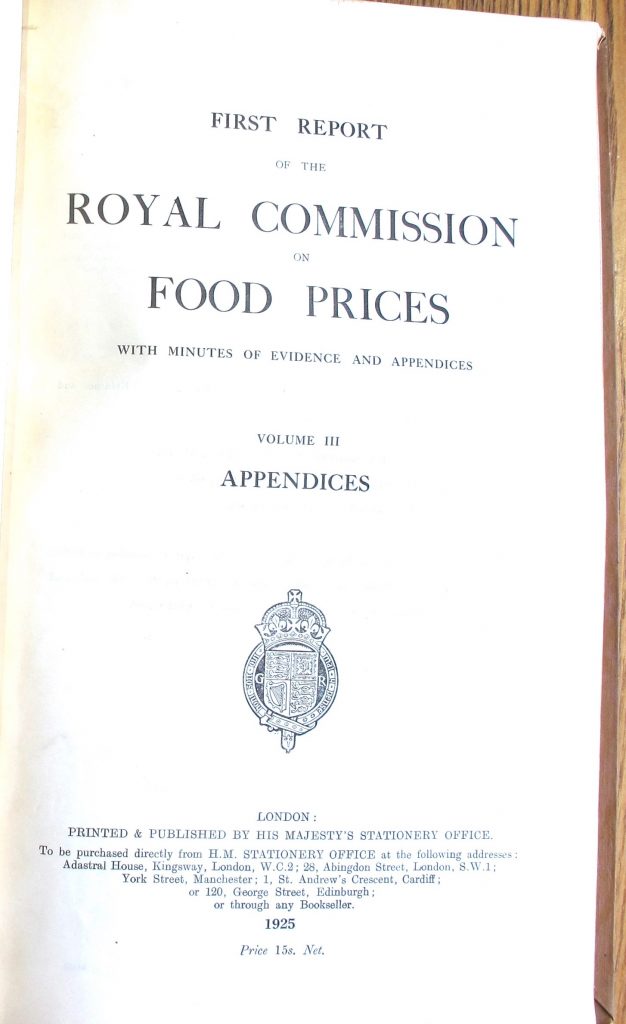
This copy of the Royal Commission’s 1925 report started life as a loose collection of pages: Newport public library bought and bound a set to make it available for future readers in the reference library.
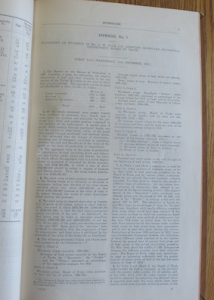
A preamble to Appendix four, written by a senior MAF official in the 1920s, confirms that both retailers and shoppers alike lacked any recourse to protection from fraudulent traders and wholesalers. The document was drafted as a government response to the recommendations of the Linlithgow committee. The ministry takes every opportunity to declare that it is powerless to tackle commercial abuses such as underpaying market gardeners for their fresh produce. The Linlithgow findings are filled with talk of malpractices on a huge scale, but somehow MAF argues that this cannot be tackled head-on because very few cases would be brought. It sounds and reads like the food industry debate to set up the Grocery code 20 years ago. Click the image below, left, to download a legible PDF.
While we are on the topic, I will add some posts about French parliamentarians Jean-Paul Charié and Michel Raison, in the context of an investigation carried out for the French parliament in the 1990s
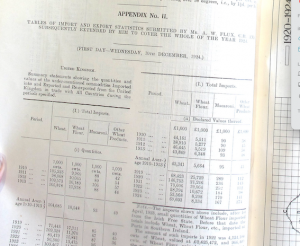
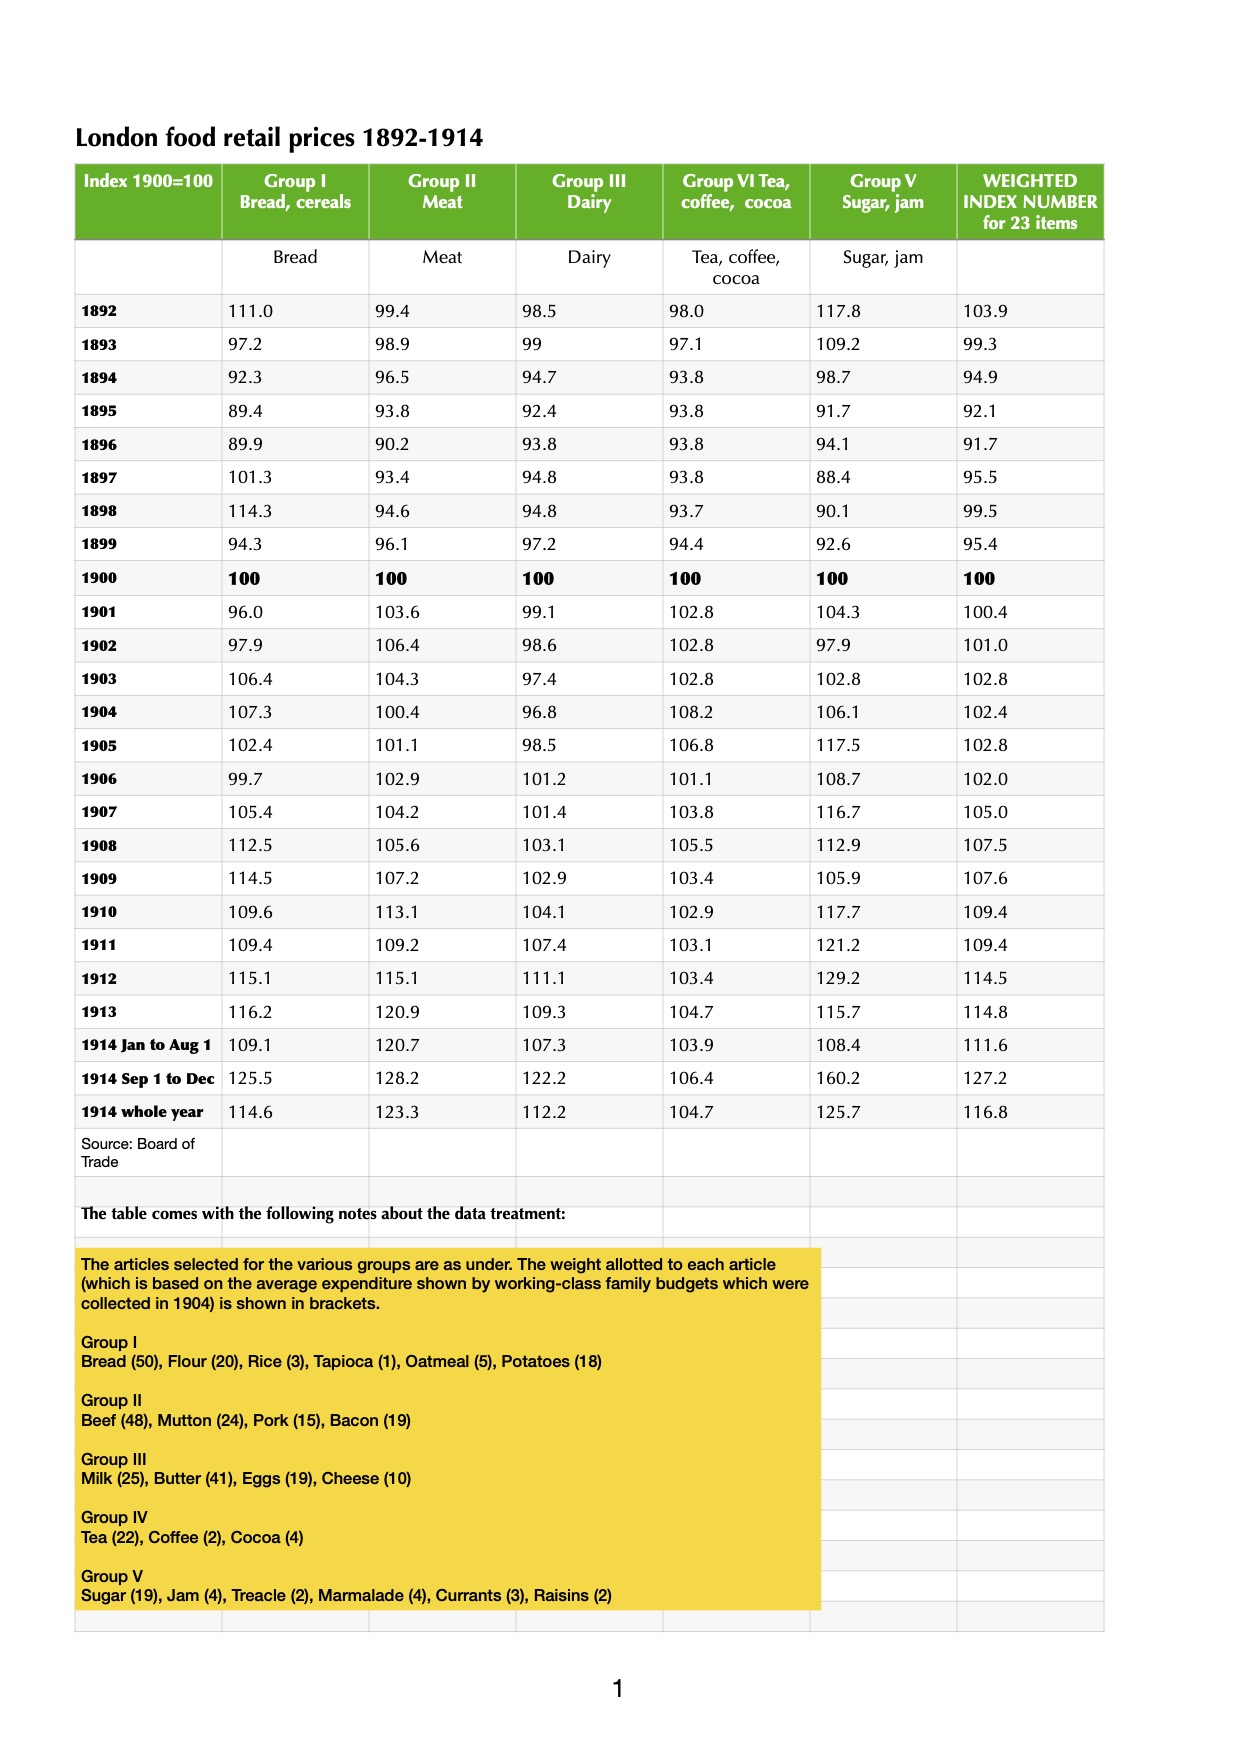
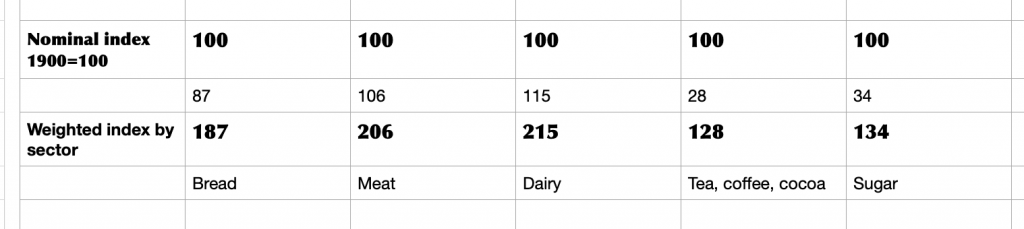
Part of the challenge of tracking down significant trends and developments in old datasets is to work out how the original compilers would have used the results. Fortunately, the Board of Trade left some clues in this snapshot of long term food price trends. The index weighting listed at the foot of the page suggests a way of reverse-engineering price differentials in a fairly robust way.
Having copied the data and the weighting factor into a two column spreadsheet listing, we can apply a SUM function to the weighting factor column. We find that there are a total of 360 tweaks applied to the base sample.
Table 6 of Appendix 3 in the Royal Commission’s report shows a series of index numbers (1900=100) for retail prices of food in London covering the years 1892 to 1914. Note that 1914 records values for January to August 1; September 1 to December and whole year. The year will be evaluated separately, since there is more movement in the economy.
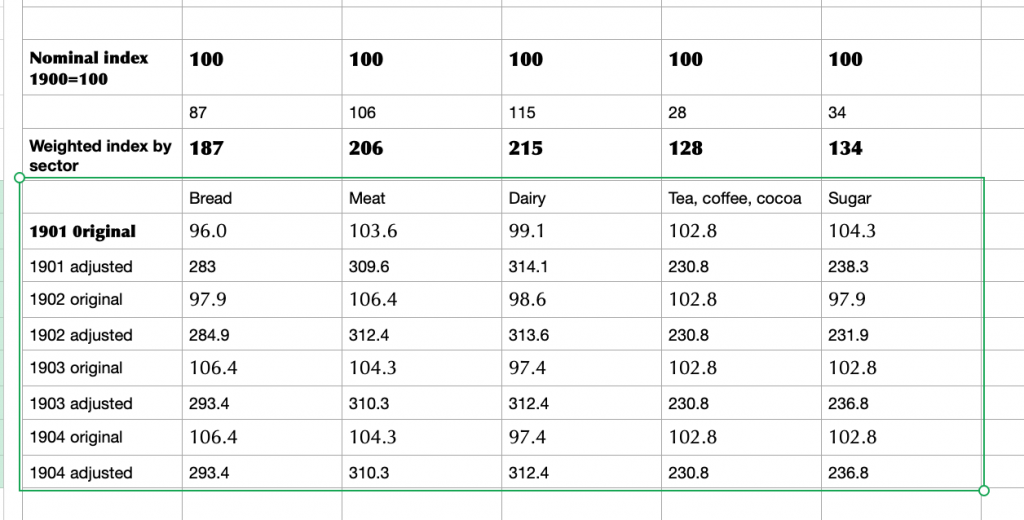
Taking the figures up to 1913, bread prices rise due to currency movements (an import dependency) as well as variable levels of market availability. Meat prices, too, show a series of significant increases. The basic {index year = 1900} presentation conceals a lot of underlying trends. The difference is plain for all to see when the index weighting factors are applied from the footnote to the data. The result is a much lumpier dataset when the modified index numbers are applied (yellow box, above).
In a spreadsheet, the year looks like this:
Applied to a small sample, it starts to look like this:
At this point, it would be tempting to go in search of grocery prices, but in a period of sustained change there are easier data to gather. Take bread at the turn of the twentieth century: adding the category index adjustment to the headline figure means a total weighting of 187 for a basic product. The cornerstone of a working class diet, no less. Meat and dairy are more costly, but consumed by a more affluent group of people. Sugar, on the other hand, has modest weighting but is a sought-after category, trading strongly to every sector in the food industry: manufacturers, wholesalers, innkeepers, caterers and retailers, not to mention arcane outlets that history was about to consign to learned footnotes. We are on the lookout for qualitative data that can tell a story rather than a dusting of quantitative data that turns us into Oliver Twist, asking for more.
The Royal Commission on Food Prices opened on Wednesday December 10, took evidence over four days, shut down over Christmas, reconvening on New Year’s Eve and worked on New Year’s Day. At this stage in the proceedings, it is worth emphasising that prices will be quoted at face value and that the historical value of the pound was constantly changing throughout these years. There may be instances when particularly clear or striking examples occur, in which case they will be covered.
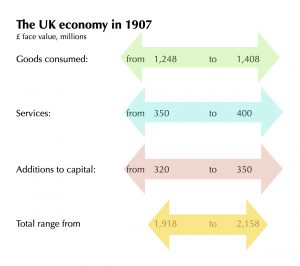
The first port of call for official figures is the Board of Trade. Working from its 1907 census of production, the prewar economy was valued at around two billion pounds (2 x 10 to the power of nine). This figure is described as “…the real income of the United Kingdom at the time to which that inquiry related.” There are a number of categories for goods consumed, each relating to the number of companies the goods went through to reach the end user: “…it was estimated that [the] charges of distribution, including the cost of transport amounted to something between one-half and two-thirds of the value of the goods at the place of production or importation.”
The aggregate value of agricultural imports (ie including some non-food products eg seeds, plants, flowers) at this time was £531,900,000, incurring £63,000,000 in customs duty and raising the customs value (in its current usage) to £595,000,000 before the goods go on to end users.