This spring, Bradford-based supermarket chain Morrisons dumped all its added value satellite profit centres, in a bid to reduce costs and consolidate its position in the English groceries market.
The closures ensure that there can never be any question of a revival of the pipe dreams Morrison family shareholders entertained years ago. Morrisons was one of a number of retailers across Europe that monitored the twists and turns in the relations between Edouard Leclerc and the former Leclerc retail member Jean-Pierre Leroch.
Harassed andconstantly attacked bitterly by his former retail partner, Leroch established Intermarché, a retail group that owned the manufacturing capacity for 20% of its retail sales. This was successful in part due to the group’s strong roots in Britanny. The Intermarché business model was admired by many and bits of it were adopted by Swiss retailer Migros, as well as the Swiss Co-op and the Basque Eroski group.
The Morrison disposals are extensions of retail departments, such as the meat or fish counters, where higher levels of product knowledge are only retained at a price. The prospect of skilled staff moving to competitors is a bigger issue to operational management than it would ever be for strategic number crunchers. This has all the signs of a desperate attempt to throw heavy kit off a hot air balloon before it crash lands.
This female factory hand was photographed at work in Birkenhead during September 1918. Photo: Wikimedia Commons.
Logistics contractors refer to it as the final mile, but many of us would settle for “delivering the goods.” It is potentially a complex stage in a product’s journey to meet the end user.
In December 1924, the LinLithgow Committee supplied the Royal Commission with four sets of operational models and an outwardly robust methodology to analyse the cost of bread. It was based on the bakers’ key ingredient, the 20-stone (127 kg) sack of flour at the heart of every batch of bread baked across the land in those days. In its day, this was a Known Value Item, to borrow a modern term. It traded at forty two shillings and a farthing, according to popular belief, not moving from one year to the next. Every baker who ever bought a sack of flour from a miller in those days paid 42s and one farthing, the story goes. Did anyone ever query the extra farthing? Where did it come from? Where did it go?
There is a serious error in the opening of the commission’s report: the sales figures of a major retailer were either misquoted by M. Charié and the record of what he said was an accurate record, or, an error was made during the transcription of an otherwise accurate account of the hearing. It consists of a total in billions being rendered in millions. It is an error anyone could have made: we are all capable of gaffes on that scale. What matters is that we untangle the original instance and ensure that there can be no repetition.
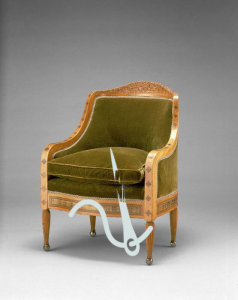
The opening pages of the Charié report (vol 1, p17) carries a parallel message, likening a distortion of competition to a pin left behind in an armchair. No matter how well-appointed the chair, a single pin can render it unuseable. (montage: Urban Food Chains)
Charié was both surprised and impressed by the quality and quantity of replies that he had recieved to his commission’s questionnaire for the coming weeks. He noted that many were hand-written and often from senior management across a wide range of sectors. While the captains of industry, large and small, were keen to see fair play, there was an unfortunate degree of flexibility in the interpretation of the basic terms such as “single price list” or “payment terms”, or even “selling at a loss”.
Regardless of the quality of the responses, it was clear that a lot remained unspoken. Would a supplier risk offending a client and potentially lose a listing, when orders, let alone listings, are hard to win? Or how many companies would openly admit to having twisted arms to extract preferential terms (answer: zero). The subject may be complex, but no-one is going to miss out on getting one over the competition.
Twenty five years ago Europe was in a state of flux. Many differing political agendas were being promoted in the belief that drafting the right regulations would somehow automatically unlock all the expectations with little or no further discussion or purpose.
If there was a single example to illustrate the processes involved, you will not be surprised to learn that I happen to think that competition issine qua non for civilised society. Considering the central role of competition in a liberal economy, it is disturbing that at no point during the closing years of the 20th century was there a single EU-backed discussion or study of commercial planning permission for urban populations. At the time, there was just one voice to be heard in the darkness, challenging the naif notion that competition would somehow develop unhindered in a bed of thistles, that we would somehow recognise this state of innocence when it emerges from the shadows. The voice was that of French deputy Jean-Paul Charié. He presided over la commission de la production et les Echanges, publishing a parliamentary report into dysfunctional competition. At the time I was a production sub on a weekly trade title . Intrigued by the subject matter and knowing that this was a one-off opportunity, I phoned the French parliament and spoke to Chariés office. I was pleasantly surprised to get a phone call back from Charié in person, when he promised to post me a copy of the report to get the full story. Sadly, I never spoke to him again, since he died, but his published work casts a bright light on topics that thenceforth couldbe debated in public with impunity. The evidence he collected on commercial malpractices came from all over Europe, painting a rather downbeat picture of how ethical standards in retailing had declined while managing to appear outwardly presentable.
Note to readers: There is a badge like the one at the top of this page, to flag up this extended series.
For some reason there are times and contexts where we do not accept the idea that there should ever be more than one way of defining an activity or a process. There are innumerable ways of defining the same thing in nature: different life forms will literally see things differently. From the outset, we need to distinguish measurements (in a standard unit) from expressions of quality (descriptive). Providing the unit of measurement is agreed explicitly in advance, there is not a lot to go wrong. This is one of the lessons that the development teams for the Hubble deep space telescope learnt the hard way.
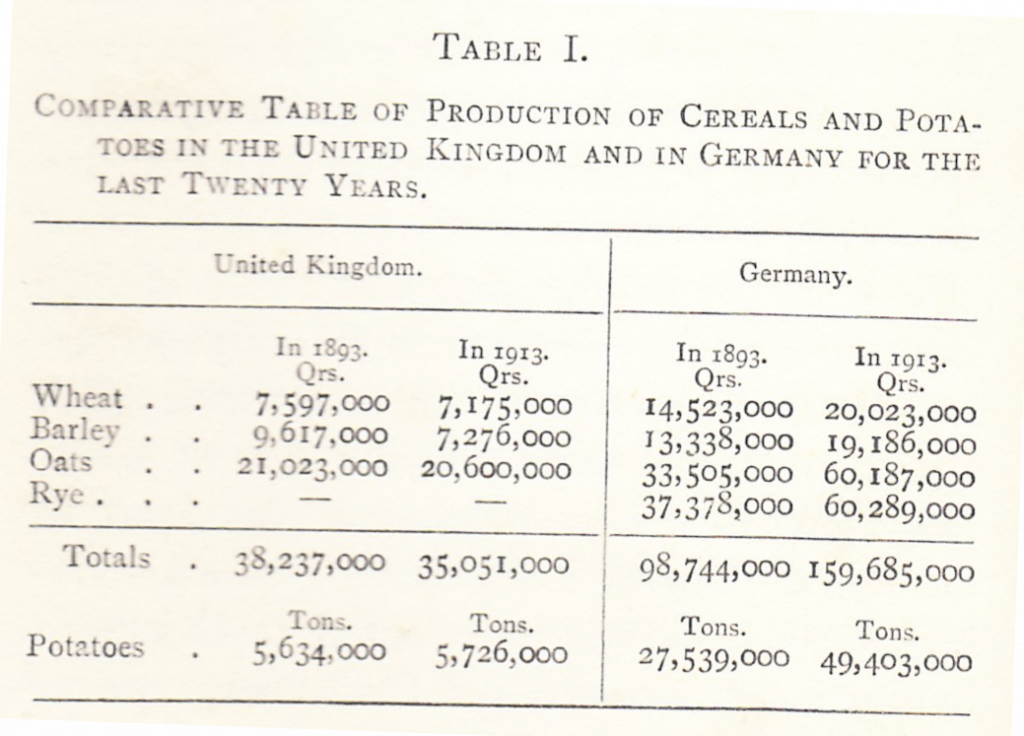
The first world war forced ever greater rates of change than the old order would ever have imagined. Here is a collection of data curated by Christopher Turnor during the first world war and published in Our Food Supply: perils and remedies (Country Life 1916). Any prices quoted are face value at the time, without any subsequent adjustment for historical changes in value. Turnor does not go into detail on the sources of his data and its authenticity, but since he had the run of market information gathered by the Agriculture Board he is unlikely to have needed to look very far. The tables in this post are mostly scanned directly from Turnor’s book, with the intention of giving readers the opportunity to form a view on Turnor’s line of argument. I have made odd comments here or there, but I defer to the readers’ many and varied viewpoints, believing they are better served by sight of the original publication.
The production figures for cereals and potatoes over a 20-year time period are open to question, but the contrasting rates of change suggest that Germany had a strategic advantage in feeding its citizens over this period in its history. Sub-plot: Germany had little access to food grown in overseas colonies, so that supply chains were shorter and more effectively protected from military action.
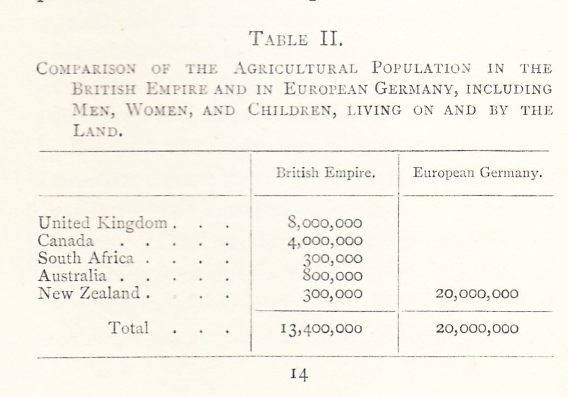
It is a moot point as to whether a rural population of 20 million in Germany is going to be more productive than thirteen and a half million British empire citizens spread around the globe. There is no obvious equivalence, since resources, skills and infrastructure are not comparable.
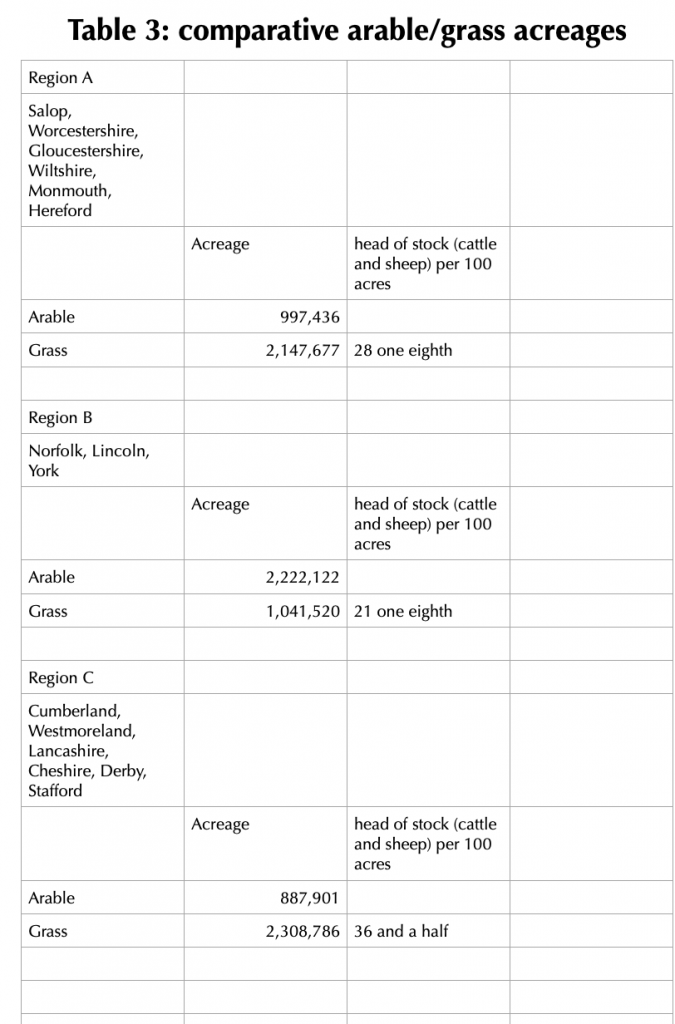
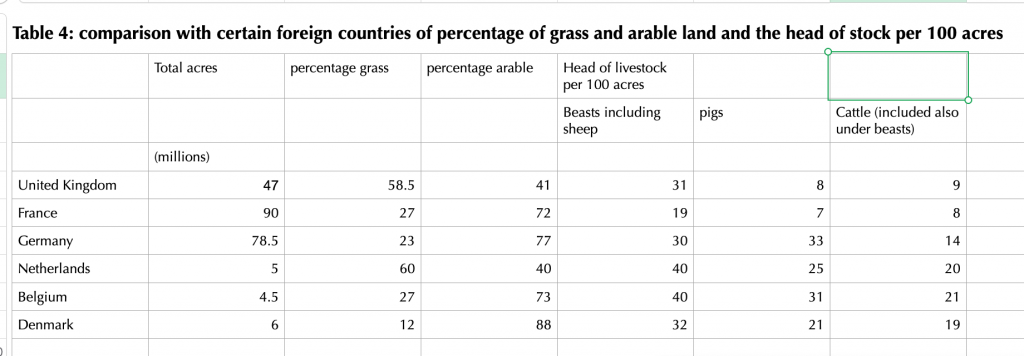
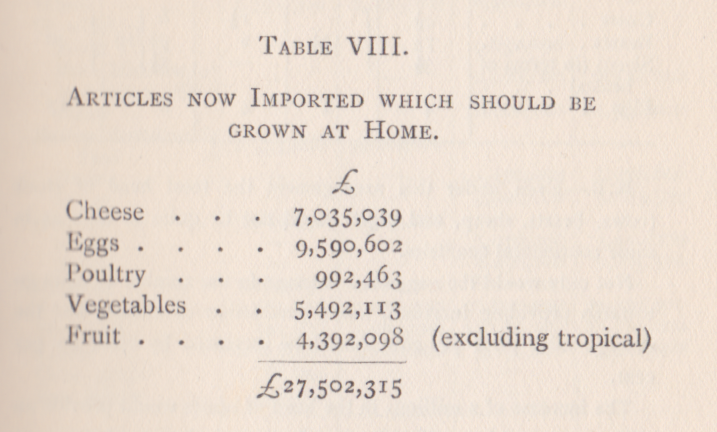
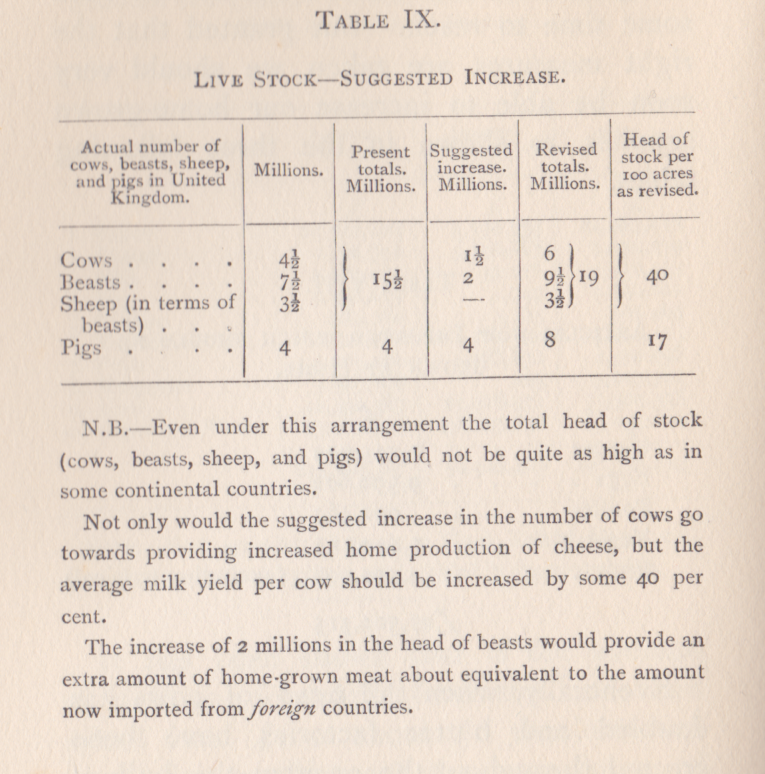
Turnor was convinced that British agriculture was being held back by a high proportion of low-earning grass supporting too few grazing animals. Here is what he wrote in 1916:
“In thinking out measures which will increase the amount of our home supplies, the permanent development of agriculture must be the aim. Attempts to increase, hastily and temporarily, the production of the soil must be ineffective and can easily be actually harmful. We must get to the root of the matter. Present conditions affecting agriculture are unsound and unsatisfactory; better ones must be created.” (Christopher Turnor; Our Food Supply, Perils and Remedies, Country Life 1916.)
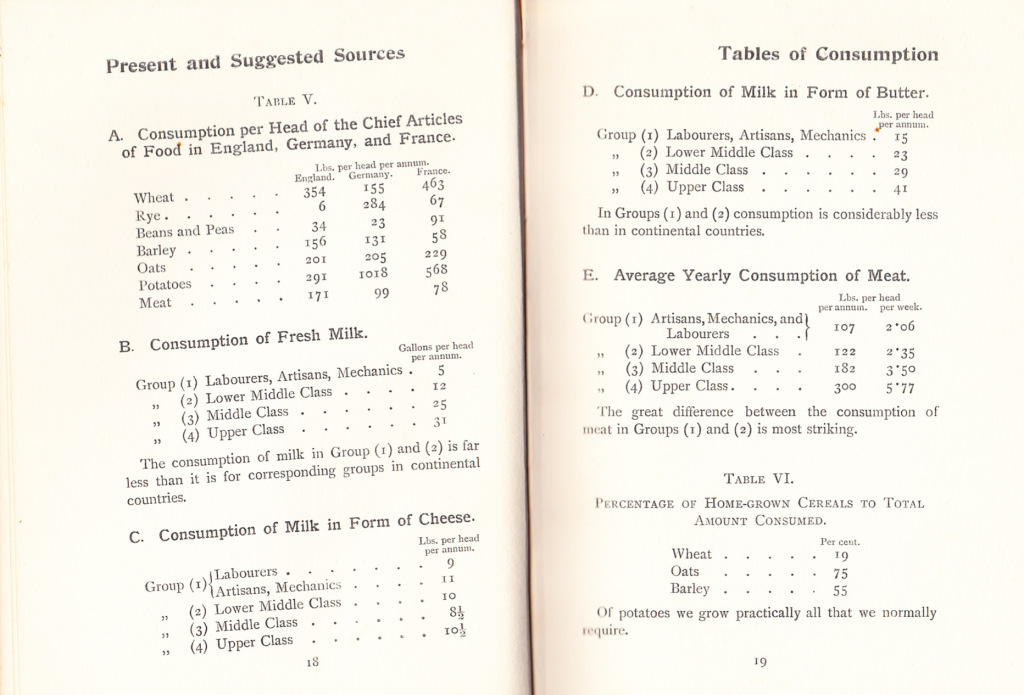
Scaling up from a county level to national comparisons, Turnor dug out the following figures during the early years of the first world war:
Turnor then presents a set of headline consumption figures. These classify ingredients and the opening table reflects national dietary preferences. The line for rye, for instance, identifies it as a German staple crop, and may well include sale of grain for brewing beer. A similar interpretation of barley being sold for malting would seem reasonable.
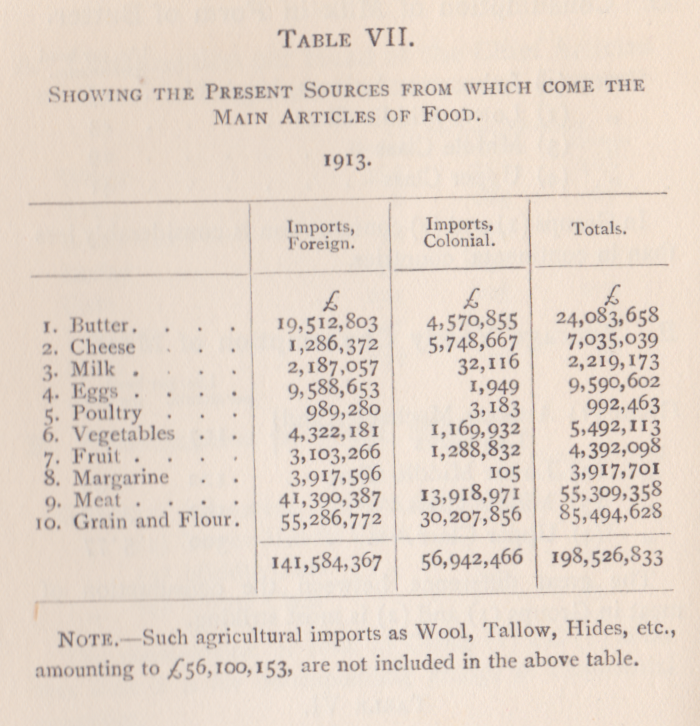
Table VII, below, sets out the cost of imported foods, probably as a set of customs values.
Stats for fifth quarter products went through the Board of Trade.
Unlike any other science, economics is prone to give away the plot before the curtain rises. Behind the scenes, everyone is committed to turn out a happy ending, almost regardless. There is ambivalence towards change, even though the job description is built around identifying and predicting the future without fear or favour.
In the summer of 1914, the Ministry of Labour started collecting the food data for the Cost Of Living Index Number. Straight out of the gate, there is no way in which vegetables other than potatoes can be included in a year-round constant economic indicator. Potatoes can be stored all round the year and can be shipped from growers all over the world, whatever the season. We have already listed the foodstuffs that were monitored and index-weighted against other products or sectors. Having seen what the Ministry of Labour brought to the table, it is time to look at how the price points for these goods were settled. The researchers searched out prices displayed by over 5,000 retailers, even though there was a lot of repetition in the mix. In some areas, shopkeepers voluntarily maintained the same prices for known value items (KVI), a practice that would be unthinkable in the twenty-first century.
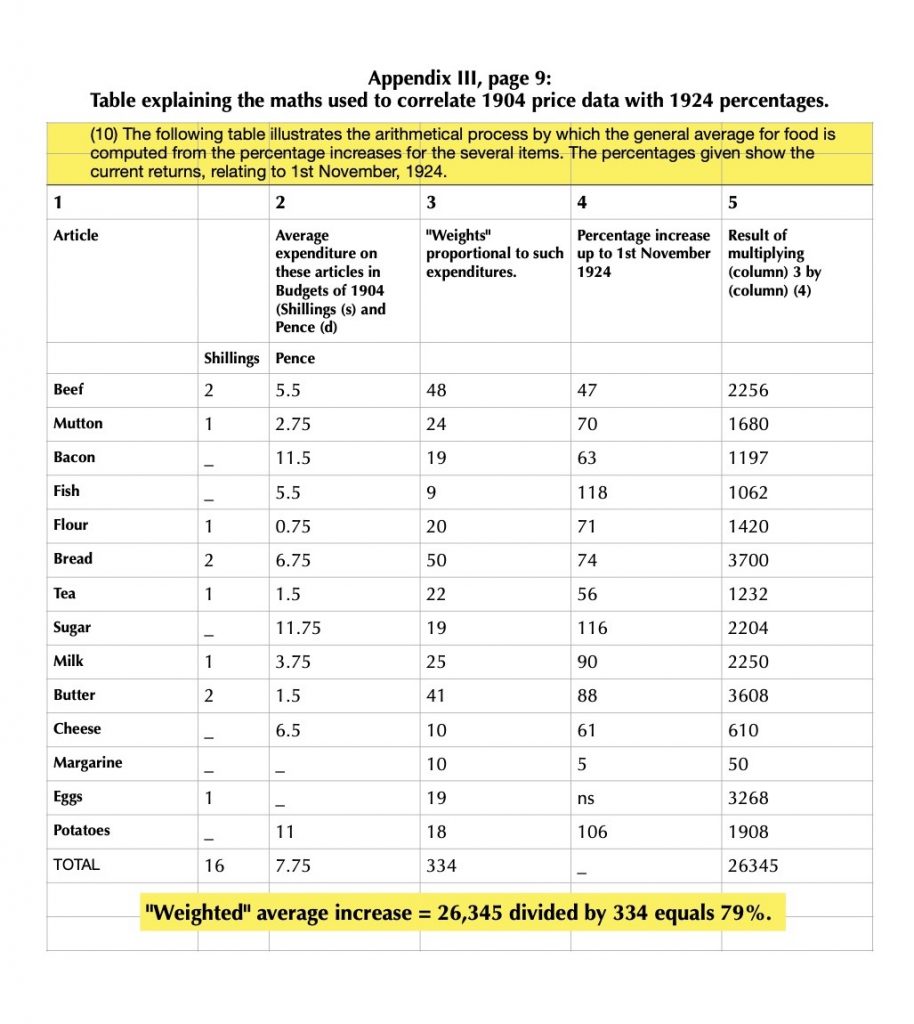
In the initial layout stages, some prices would be queried: if the point is to gather live data, it should be taken as found, warts and all. Modern food manufacturers refer to a group of products that are “liquid with identifible lumps” and I would apply the “identifiable lumps” analogy to raw price data. The lumps are the very point of the work in hand, giving both insight and substance. The process moves up a gear, averaging the product families and applying percentage shifts to some big and bulky calculations. Statistics at this level is not for the faint-hearted. The table below, taken from November 1924, is an example of the genre. Readers will notice that in this table, farthings are counted as 0.25, but this will change in the not-too-distant future to an integer, pure and simple.
The consumer panel was first used by the Board of Trade in 1904, when 1,944 urban working households were recruited. A footnote on page nine of the evidence volume reads:
The validity of using the budgets of 1904 was confirmed by the Working Classes Cost of Living Committee of 1918, under the Chairmanship of Lord Sumner, who reported that it was fairly certain that “Between 1904 and 1914…..no considerable changes took place in the mode or standard of living.”
The household data was calculated on the basis of the weight of food purchased, making comparisons between years more reliable, the civil servants argued. It is a moot point that a shop price in pounds, shillings and pence should resolve into a comparable pounds and ounces value at the table. To start with, the purchasing power of cash can and does change. The world in which we live is moving away from meaningful comparisons with previous eras, which need to be taken with a pinch of salt.
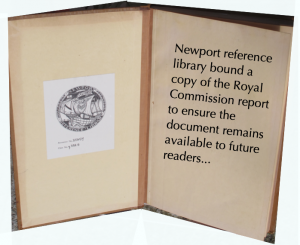
This copy of the Royal Commission’s 1925 report started life as a loose collection of pages: Newport public library bought and bound a set to make it available for future readers in the reference library.
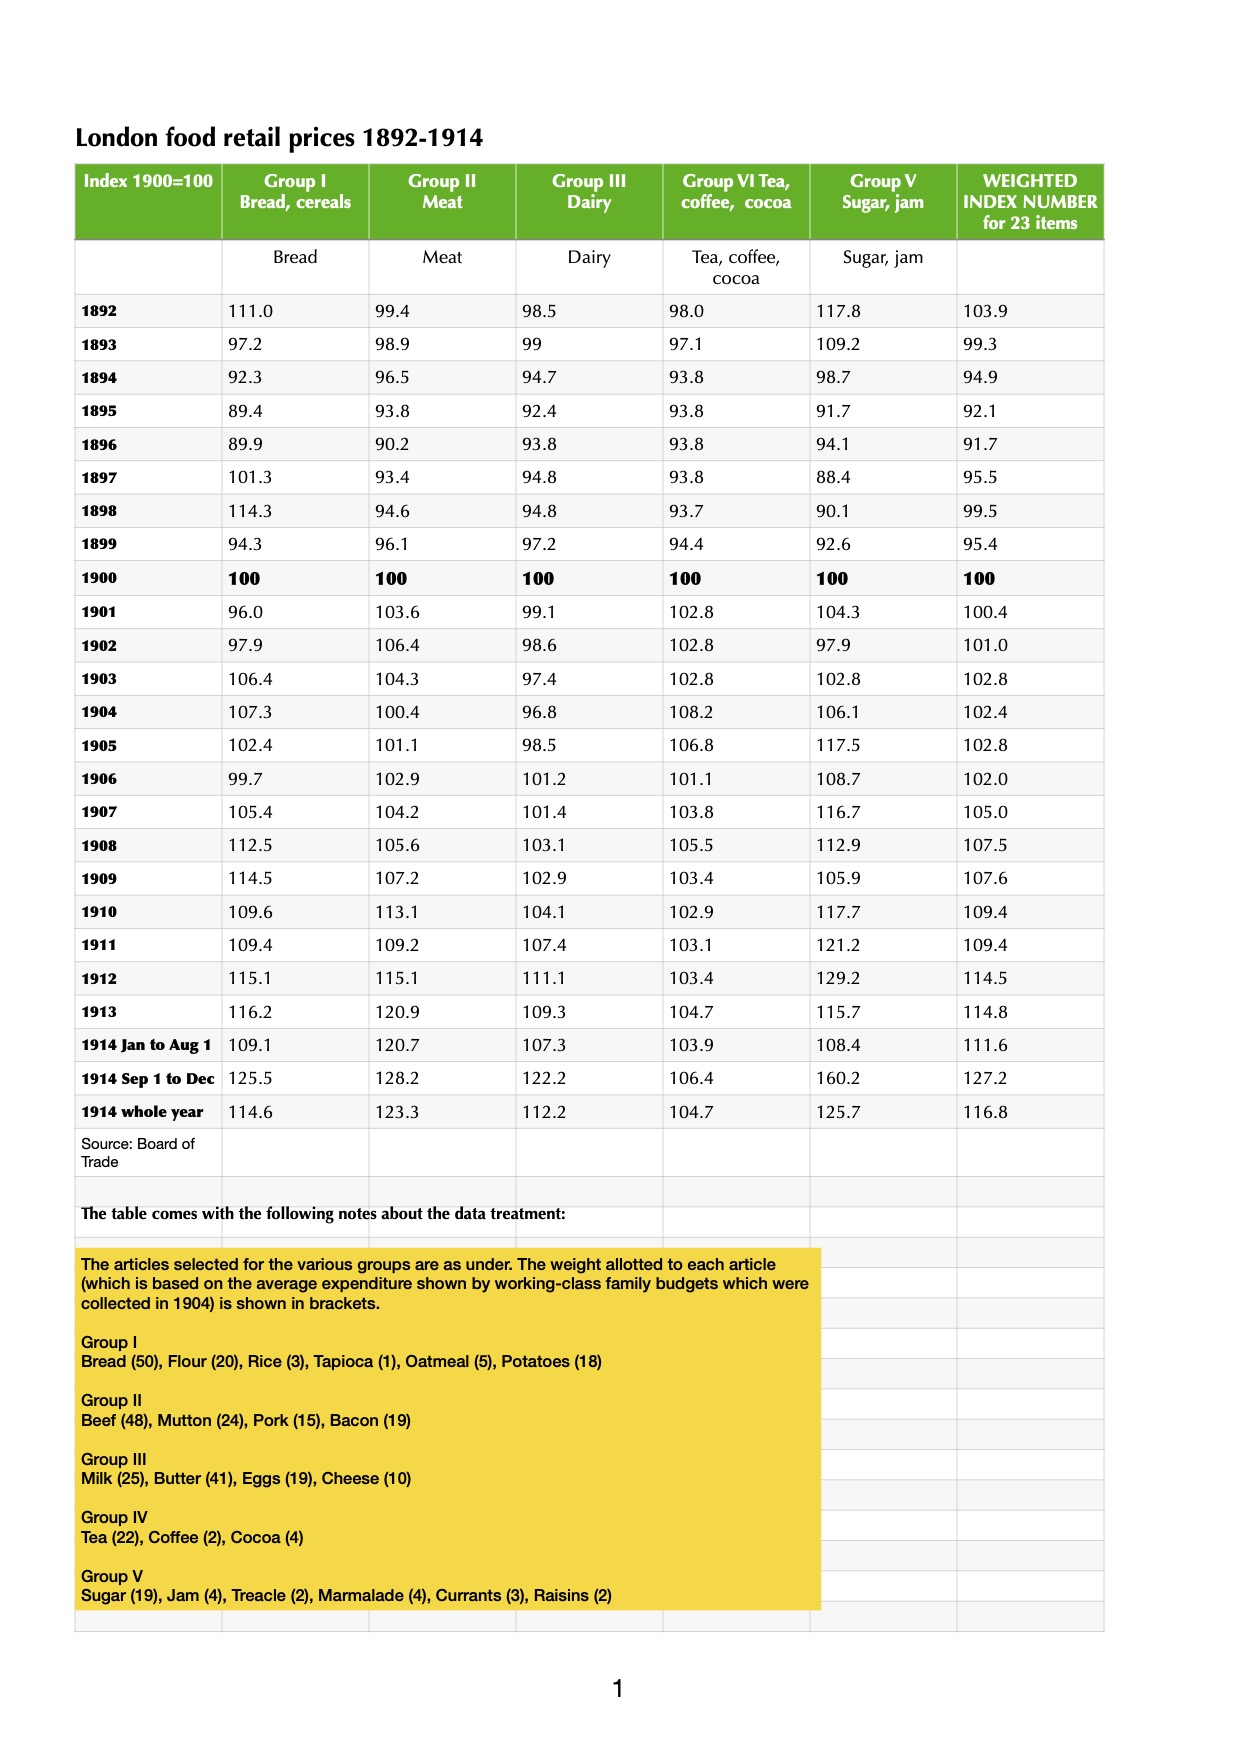
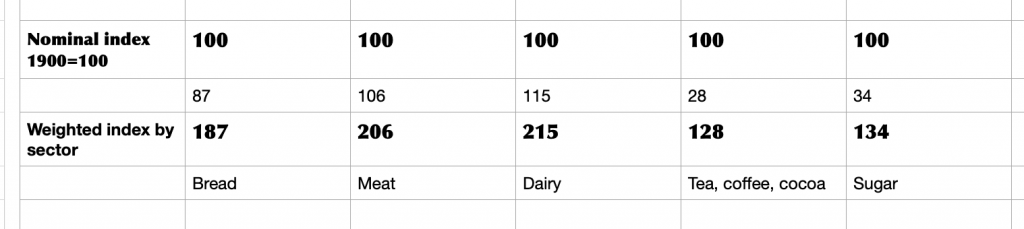
Part of the challenge of tracking down significant trends and developments in old datasets is to work out how the original compilers would have used the results. Fortunately, the Board of Trade left some clues in this snapshot of long term food price trends. The index weighting listed at the foot of the page suggests a way of reverse-engineering price differentials in a fairly robust way.
Having copied the data and the weighting factor into a two column spreadsheet listing, we can apply a SUM function to the weighting factor column. We find that there are a total of 360 tweaks applied to the base sample.
Table 6 of Appendix 3 in the Royal Commission’s report shows a series of index numbers (1900=100) for retail prices of food in London covering the years 1892 to 1914. Note that 1914 records values for January to August 1; September 1 to December and whole year. The year will be evaluated separately, since there is more movement in the economy.
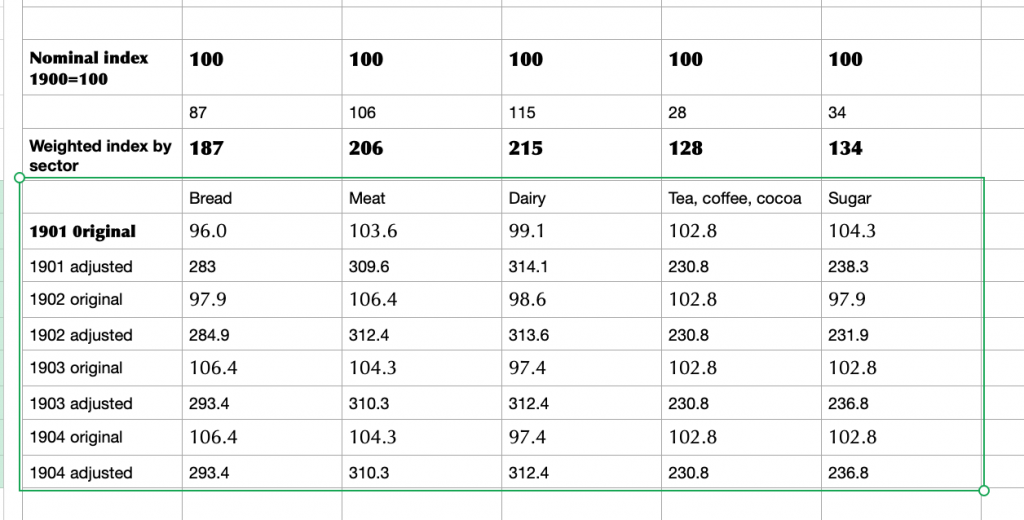
Taking the figures up to 1913, bread prices rise due to currency movements (an import dependency) as well as variable levels of market availability. Meat prices, too, show a series of significant increases. The basic {index year = 1900} presentation conceals a lot of underlying trends. The difference is plain for all to see when the index weighting factors are applied from the footnote to the data. The result is a much lumpier dataset when the modified index numbers are applied (yellow box, above).
In a spreadsheet, the year looks like this:
Applied to a small sample, it starts to look like this:
At this point, it would be tempting to go in search of grocery prices, but in a period of sustained change there are easier data to gather. Take bread at the turn of the twentieth century: adding the category index adjustment to the headline figure means a total weighting of 187 for a basic product. The cornerstone of a working class diet, no less. Meat and dairy are more costly, but consumed by a more affluent group of people. Sugar, on the other hand, has modest weighting but is a sought-after category, trading strongly to every sector in the food industry: manufacturers, wholesalers, innkeepers, caterers and retailers, not to mention arcane outlets that history was about to consign to learned footnotes. We are on the lookout for qualitative data that can tell a story rather than a dusting of quantitative data that turns us into Oliver Twist, asking for more.
With coffee trading at over USD 4 / lb and cocoa prices hovering around GBP 9,000 / ton, traders are preparing for an increasingly stormy market. Over the past year, supply chain experts have logged a growing number of unseasonally hot weather episodes that have been followed by recent sharp rises in commodity prices. Coffee, in particular, is vulnerable to extreme conditions: the first coffee trees were found fruiting in the mid-height levels of a rain forest canopy and their modern descendants have not adapted well to growing conditions on open ground.
There are product prices that are monitored closely by retailers, which earn high margins, such as orange juice, butter or beef. The theory is that while customers are still buying products in these categories, consumer demand is intact. More problematic is the availability of a raw material like sunflower oil, a major crop in Ukraine and Bulgaria. With Ukrainian crops hit by war as well as drought last year, a wide range of food manufacturing businesses have seen sunflower oil price rises of 50% and more. It does not take many ingredient prices to start moving upwards for life to become very hard for any business that supplies multiple retailers, who systematically refuse to countenance price increases.

 This spring, Bradford-based supermarket chain Morrisons dumped all its added value satellite profit centres, in a bid to reduce costs and consolidate its position in the English groceries market.
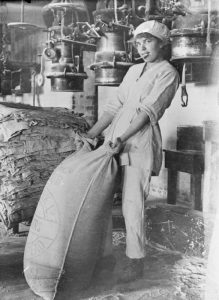
 The opening pages of the Charié report (vol 1, p17) carries a parallel message, likening a distortion of competition to a pin left behind in an armchair. No matter how well-appointed the chair, a single pin can render it unuseable. (montage: Urban Food Chains)