

Part of the challenge of tracking down significant trends and developments in old datasets is to work out how the original compilers would have used the results. Fortunately, the Board of Trade left some clues in this snapshot of long term food price trends. The index weighting listed at the foot of the page suggests a way of reverse-engineering price differentials in a fairly robust way.
Having copied the data and the weighting factor into a two column spreadsheet listing, we can apply a SUM function to the weighting factor column. We find that there are a total of 360 tweaks applied to the base sample.
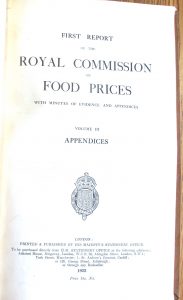
Table 6 of Appendix 3 in the Royal Commission’s report shows a series of index numbers (1900=100) for retail prices of food in London covering the years 1892 to 1914. Note that 1914 records values for January to August 1; September 1 to December and whole year. The year will be evaluated separately, since there is more movement in the economy.
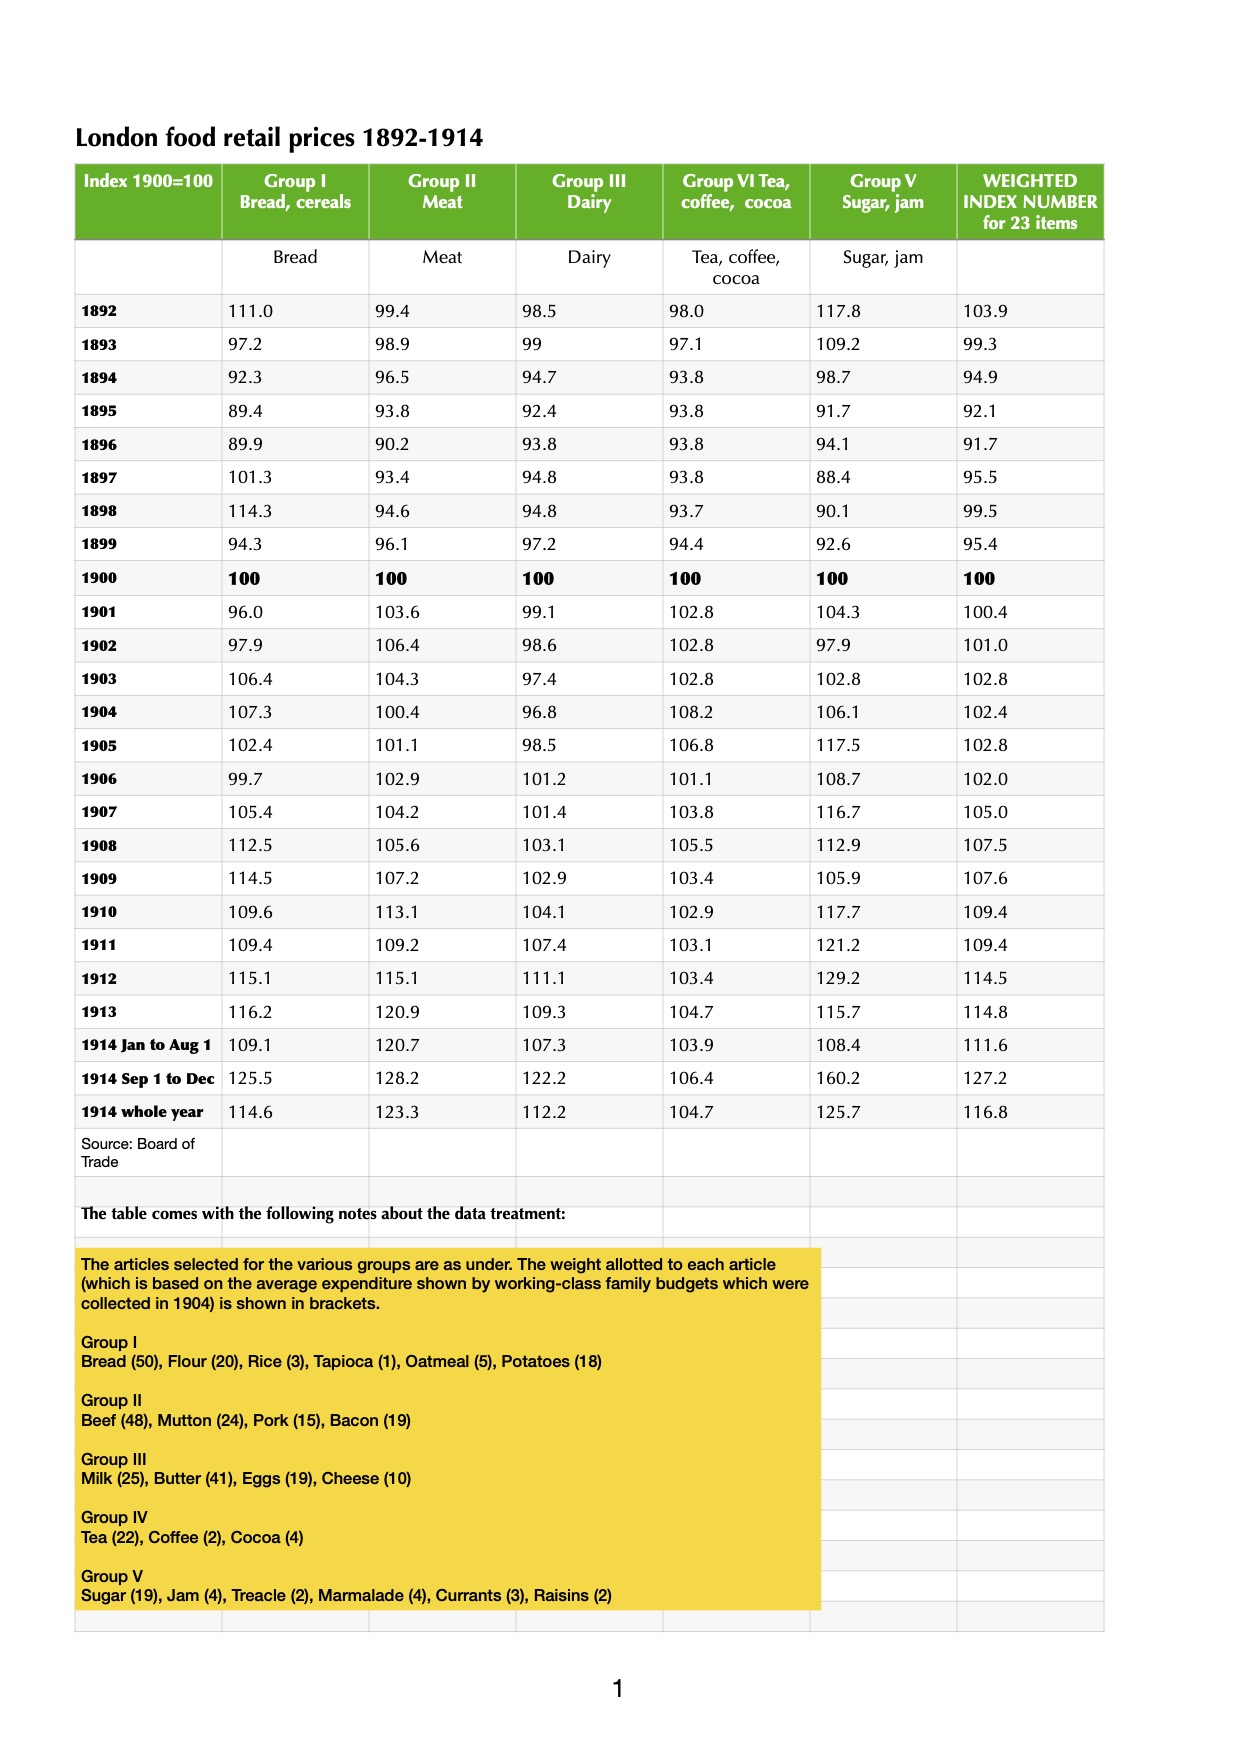
Taking the figures up to 1913, bread prices rise due to currency movements (an import dependency) as well as variable levels of market availability. Meat prices, too, show a series of significant increases. The basic {index year = 1900} presentation conceals a lot of underlying trends. The difference is plain for all to see when the index weighting factors are applied from the footnote to the data. The result is a much lumpier dataset when the modified index numbers are applied (yellow box, above).
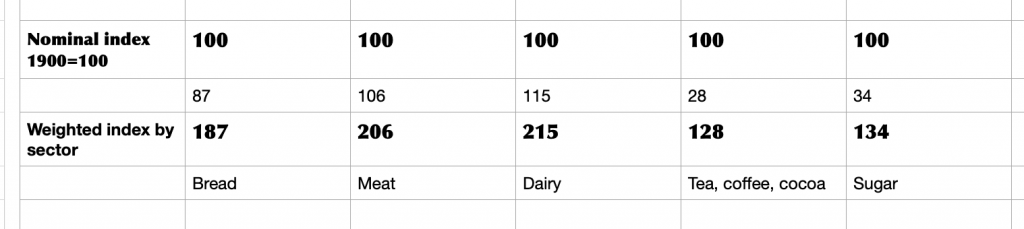
In a spreadsheet, the year looks like this:
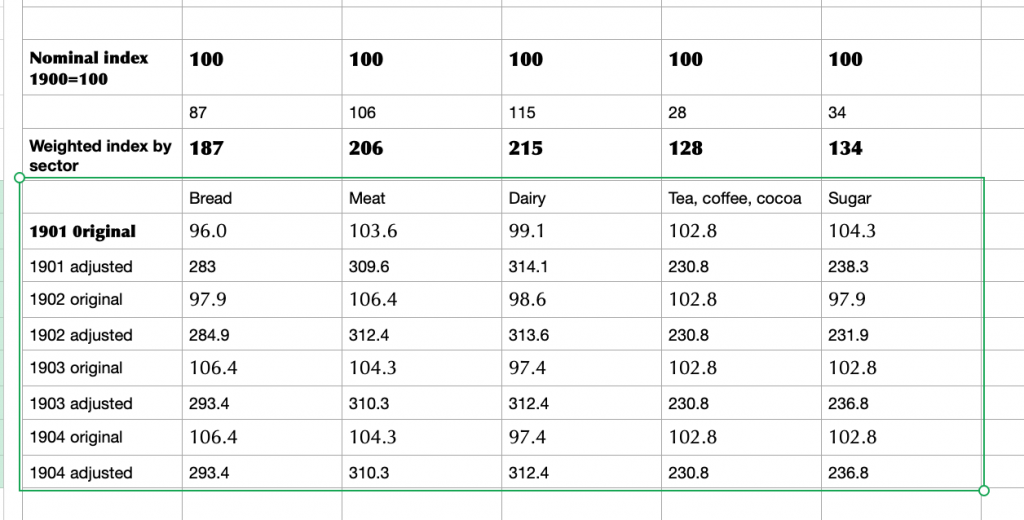
Applied to a small sample, it starts to look like this:
At this point, it would be tempting to go in search of grocery prices, but in a period of sustained change there are easier data to gather. Take bread at the turn of the twentieth century: adding the category index adjustment to the headline figure means a total weighting of 187 for a basic product. The cornerstone of a working class diet, no less. Meat and dairy are more costly, but consumed by a more affluent group of people. Sugar, on the other hand, has modest weighting but is a sought-after category, trading strongly to every sector in the food industry: manufacturers, wholesalers, innkeepers, caterers and retailers, not to mention arcane outlets that history was about to consign to learned footnotes. We are on the lookout for qualitative data that can tell a story rather than a dusting of quantitative data that turns us into Oliver Twist, asking for more.
Leave a Reply