Next month town halls up and down the UK will be holding local elections. In past years, this multifaceted media matrix has not been covered in these pages. But this year, when the votes are counted, the distribution of political power across the landscape will change before a single committee meets or a single bin is emptied.
On May 7, voters will choose more than 4850 local councillors to run 134 local authorities. While the buildings will not look any different, the ways in which they will work will change literally overnight. Will the root causes of regional misunderstandings melt away in the warmth of a new dawn? The newly-constituted authorities will need to ensure funds remain available for local planning officials to have a better grasp of agricultural issues in their decision-making processes. Pigs might fly. Making waste disposal sites accessible and affordable can reduce the temptation to resort to fly tipping. Realistically, rural policing policy can only be based on lower population densities outside urban zones.
While canvassing for the local council elections, candidates can expect to face hostility on the doorstep on topics they have no control over. These could be items such as longer waiting lists for healthcare or services that voters believe to be cheaper/more reliable/generally favouring urban areas.
The lower density of rural populations made the provision online capacity less attractive for early commercial internet providers. Satellite services get round a lot of the transmission issues that faced early broadband services, but are not totally immune from signal issues, such as sunspots and solar flares. Sending a service engineer to repair a network outage in Dagenham can be covered by a simple phone call, while restoring an array of satellites takes some forward planning.

Tom Broadshaw has been speaking up for years to get fairer treatment for everyone in the supply chain.
Rather than accepting crumbs from the urban table, UK farmers need a market mechanism that protects their interests. For instance, as the law stands, farmers have no rights as suppliers to supermarkets. This fails to recognise the role food producers in mult-party supplier agreements, as well as being unfair. This particular bone of contention has been running for years now, NFU President Tom Bradshaw explained: “Farming is the backbone of our rural economy and lifeblood of rural communities. Our farmers manage over 70% of the landscape, protect enhance the environment and produce food for 70 million people.”
Confidence within the sector remains low. “Farm businesses are under extreme cost pressure, Bradshaw added. “Pressures for seed has been running high, fuel and fertiliser are exacerbated by geopolitical tensions,” he declared. Starting with the invasion of Ukraine and now the war in the Middle East, the political outlook is not predictable. Add it to the unstable climate and extreme weather and we all face problems that will impact our ability to produce food.
 “Decisions being taken by local authorities can have a direct and lasting impact on farm businesses and the communities they support. By championing pro-farming policies on areas such as planning, rural crime and the procurement of more British food, councils aren’t just supporting individual farming businesses — they can help turn the tide and shape the future of our industry by increasing our collective resilience.”
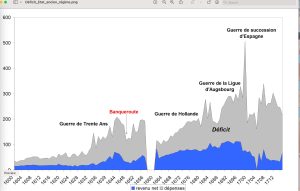
 Once in a while, somebody releases statistics or data that tells a complete story in figures alone. Take this example from the National Farmers’ Union (NFU) last week.
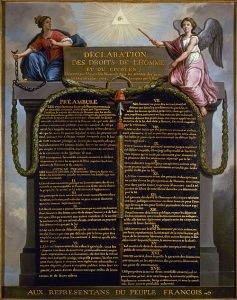 The opening weeks of the French revolution saw the drafting of a declaration establishing the existence of human rights and what each person was obliged to do to protect the same rights and privileges for their fellow citizens. These boundaries can only be determined by law. As we shall see later, there was no
 For France’s parliamentarians, 1993 ended with some progress, but without a readily identifiable outcome. To be sure, national legislation had got a better grip on the systematic abuses of commercial practice, but there remained a lot of work to finish before anyone would be able to say they had anything solid to show for it. The